PARDOT ENGAGEMENT STUDIO REPORTING
As user-friendly as this tool is, the Performance Metrics and in particular, a shareable format of Performance metrics is not its strongest suit.
The only option that Pardot offers out of the box is (Engagement Studio Reporting) is very limited.
If you have a Pardot account and you would like to have an overall idea of where prospects are in the process, the Report functionality is perfectly fine. But when you need to share the Performance metrics with your Management team, or have a Dashboard that would sum up the statistics for each step of the Engagement Program.
The good news: there is a way to do it!
The not so good news: it’s a bit cumbersome / “creative” solution that requires a quite some time to implement for the first time (the second time around it will be much faster).
So here goes:
How to get a detailed performance metrics for a Pardot Engagement Studio Program?
(step by step guide)
Option 1: SALESFORCE CAMPAIGN
1. Create SF campaign (in Classic)

2. List the Steps/Checkpoints that you will need the stats for. Ex. 1st email Open, 1st Email Clicked, Registered for Webinar etc.
3. Use this list to set a Custom Campaign Member status in Salesforce (Click Advanced Setup – Edit) (NOTE: it only works this way in Classic for now – to help it get there you can upvote the idea)
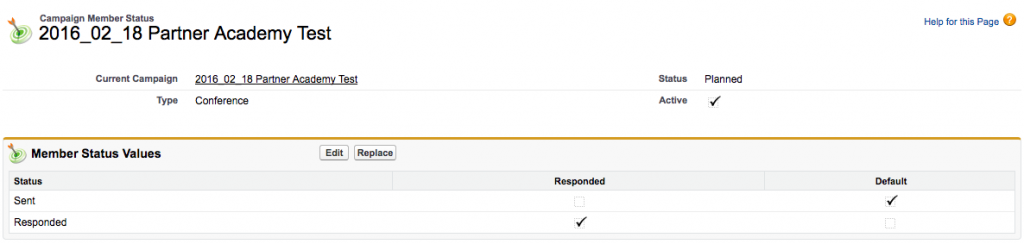
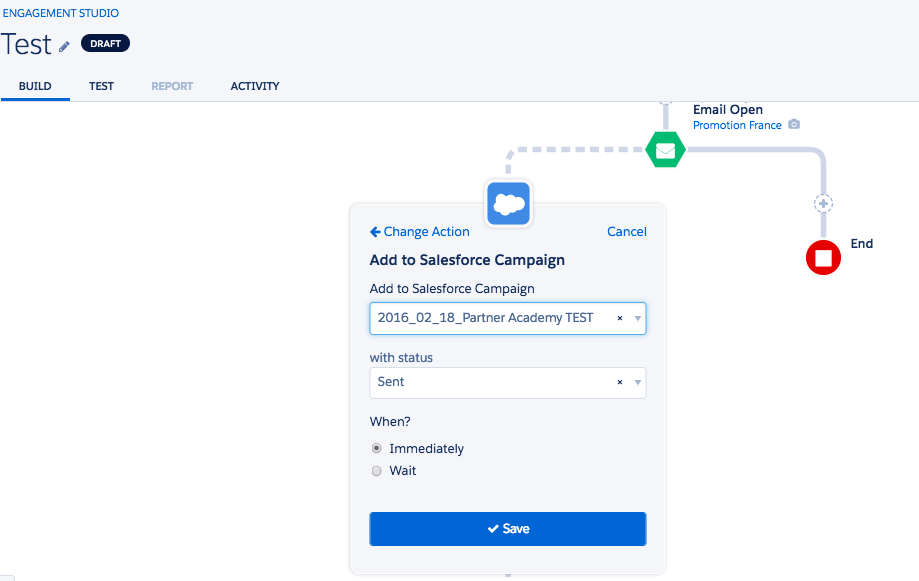
4. Add the “Checkpoints” in the Engagement studio by using Action -> Add to Salesforce Campaign – with Status (choose the appropriate value from the list)
5. Build the Standard Salesforce Report for the given Campaign and group Campaign Members by Status.
Option2: PARDOT TAGS
The other way to go about it would be using Pardot Tags and similar Logic of the Checkpoints
1. List the Steps/Checkpoints that you will need the stats for. Ex. 1st email Open, 1st Email Clicked, Registered for Webinar etc.
2. Use this list to set a Tags in Pardot
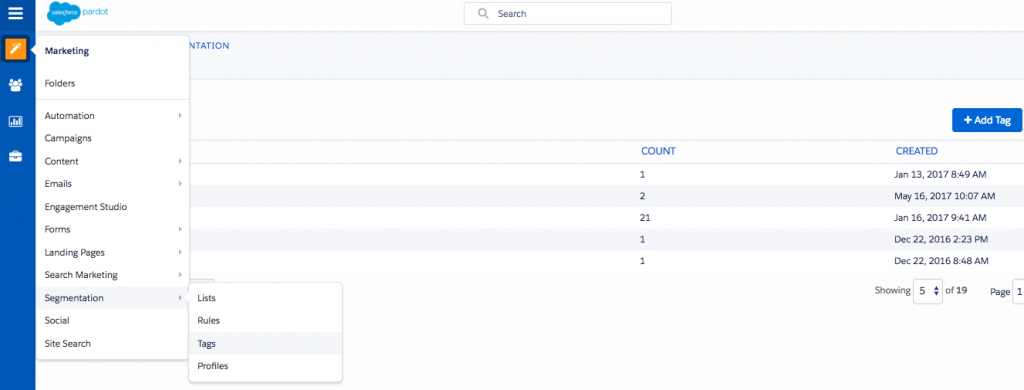
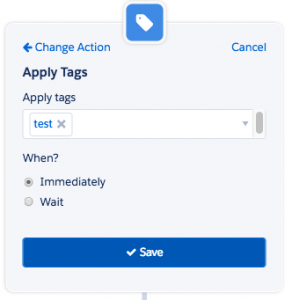
3. Add the “Checkpoints” in the Engagement studio by using Action -> Add Tag
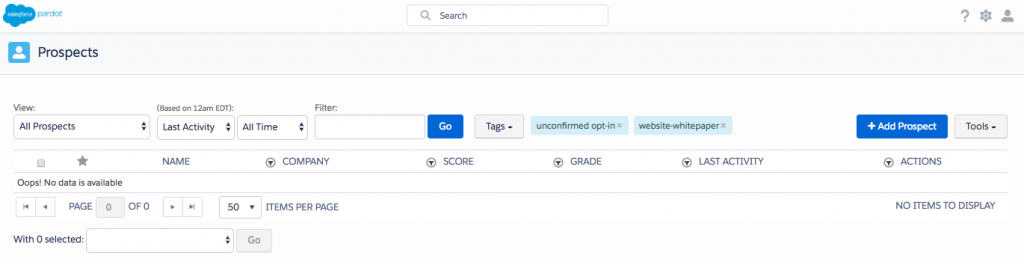
4. Go to Prospects -> Prospect List, Filter by Tags (including all the relevant tags) -> Export CSV and build Excel Chart. Tip: use the naming conventions by Engagement Program Title – Step so that you can use search when choosing tags
The down point of this path is obviously the Tags Overload: with Every Next engagement program you create N new tags